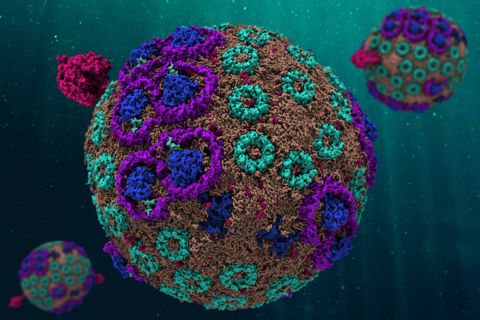
Atoms to Phenotypes: Molecular Design Principles of Cellular Energy Metabolism

We report a 100-million atom-scale model of an entire cell organelle, a photosynthetic chromatophore vesicle from a purple bacterium, that reveals the cascade of energy conversion steps culminating in the generation of ATP from sunlight. Molecular dynamics simulations of this vesicle elucidate how the integral membrane complexes influence local curvature to tune photoexcitation of pigments. Brownian dynamics of small molecules within the chromatophore probe the mechanisms of directional charge transport under various pH and salinity conditions. Reproducing phenotypic properties from atomistic details, a kinetic model evinces that low-light adaptations of the bacterium emerge as a spontaneous outcome of optimizing the balance between the chromatophore’s structural integrity and robust energy conversion. Parallels are drawn with the more universal mitochondrial bioenergetic machinery, from whence molecular-scale insights into the mechanism of cellular aging are inferred. Together, our integrative method and spectroscopic experiments pave the way to first-principles modeling of whole living cells.
Summary of All Processes Involved in Energy Conversion in the Photosynthetic Chromatophore. Energy conversion processes starting after initial light absorption are divided into three stages: (1) quinol production at RC as a result of excitation transfer; (2) diffusion between RC and cytbc1 of quinone/ quinol and cyt c2, together with quinol-to-quinone conversion resulting in a proton gradient across the vesicle membrane; (3) utilization of proton gradient for ATP synthesis
Adaptive Poisson Boltzmann Solver (APBS)-Computed Electrostatic Potential Isosurfaces of the Inner Chromaphore Vesicle, Depicted as a Function of Changing Salt Strength at pH 7. The color blue indicates +5 KT/e and red −5 KT/e. The chosen salinities are 0.02 M, 0.04 M, 0.06 M, 0.08 M, 0.15 M, 0.25 M, 0.35 M, 0.45 M, 0.55 M, 0.65 M, 0.75 M, 0.85 M, 0.95 M. The inner vesicle is primarily negative with local patches of positive potential. Beyond frame no. 5 in the movie (0.15 M salinity), the potential and consequently the net effective charge (Figure 5) changes minimally.
Diffusive Motion of Two Cyt c2 Molecules in the Chromatophore Vesicle, Simulated Using Atom-Resolved Brownian Dynamics (ARBD). Close to the center of the vesicle the trajectories of the cyt c2 molecules significantly overlap. However, in the vicinity of the membrane surface the trajectories deviate. While the blue (oxidized ones) move toward the RC-LH1, the red (reduced ones) are found closer to the bc1 complex.