SDS-assisted protein transport through solid-state nanopores
Using nanopores for single-molecule sequencing of proteins - similar to nanopore-based sequencing of DNA - faces multiple challenges, including unfolding of the complex tertiary structure of the proteins and enforcing their unidirectional translocation through nanopores. Here, we combine molecular dynamics (MD) simulations with single-molecule experiments to investigate the utility of SDS (Sodium Dodecyl Sulfate) to unfold proteins for solid-state nanopore translocation, while simultaneously endowing them with a stronger electrical charge. Our simulations and experiments prove that SDS-treated proteins show a considerable loss of the protein structure during the nanopore translocation. Moreover, SDS-treated proteins translocate through the nanopore in the direction prescribed by the electrophoretic force due to the negative charge impaired by SDS. In summary, our results suggest that SDS causes protein unfolding while facilitating protein translocation in the direction of the electrophoretic force; both characteristics being advantageous for future protein sequencing applications using solid-state nanopores.
Movie 1. Self-assembly of a titin-SDS complex. The movie illustrates a 300 ns explicit solvent all-atom MD simulation. The protein backbone is shown in blue, SDS molecules in cyan and red, water and 0.4 M NaCl are now shown. A smoothing filter was applied to visually reduce thermal motion of the molecules. The initial configuration was prepared by combining an unfolded conformation of a protein with 120 randomly distributed SDS molecules. The systems were simulated at 373 K for the first 200 ns. Following that, the systems were cooled down to 300 K in eight simulation runs, decreasing the system’s temperature by 10 K between each run. Following that, the SDS-protein systems were simulated for another 50 ns at 300 K.
Movie 2. MD simulation of folded titin translocation. The movie illustrates a 60 ns explicit solvent all-atom MD simulation carried out under a 500 mV bias directed from the bottom to the top of the simulation system. The nanopore is shown as a cutaway green molecular surface, the protein (red) is shown in a cartoon representation, water and 0.4 M NaCl are now shown. During the simulation, the center of mass of the protein was restrained to remain at the symmetry axis of the nanopore.
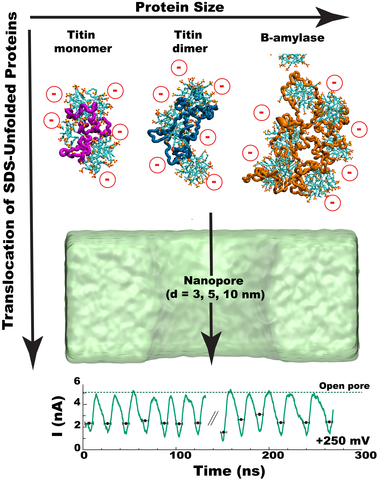
Movie 3. MD simulation of SDS-titin complex translocation. The movie illustrates a 100 ns explicit solvent all-atom MD simulation carried out under a 250 mV bias directed from the bottom to the top of the simulation system. The nanopore is shown as a cutaway green molecular surface; the protein conformation is depicted as a trace of the protein backbone (magenta). The SDS molecules are shown using the molecular bonds representation: Carbon, sulfur and oxygen atoms are shown in cyan, yellow and red, respectively, hydrogen atoms are not shown. Water and 0.4 M NaCl are now shown as well. During the simulation, the center of mass of the SDS-protein complex was restrained to remain at the symmetry axis of the nanopore. A smoothing filter was applied to visually reduce thermal motion of the molecules. Because of the periodic boundary conditions employed in our MD simulations, the same SDS-protein complex is seen to permeation through the nanopore multiple times. Flickering of the molecules is produced by crossings between different periodic images of the simulation unit cell.
Movie 4. MD simulation of SDS-titin dimer complex translocation. The movie illustrates a 50 ns explicit solvent all-atom MD simulation carried out under a 250 mV bias directed from the bottom to the top of the simulation system. The nanopore is shown as a cutaway green molecular surface; the protein conformation is depicted as a trace of the protein backbone (light blue). The SDS molecules are shown using the molecular bonds representation: Carbon, sulfur and oxygen atoms are shown in cyan, yellow and red, respectively, hydrogen atoms are not shown. Water and 0.4 M NaCl are now shown as well. During the simulation, the center of mass of the SDS-protein complex was restrained to remain at the symmetry axis of the nanopore. A smoothing filter was applied to visually reduce thermal motion of the molecules. Because of the periodic boundary conditions employed in our MD simulations, the same SDS-protein complex is seen to permeation through the nanopore multiple times. Flickering of the molecules is produced by crossings between different periodic images of the simulation unit cell.
Movie 5. MD simulation of SDS-beta amylase complex translocation. The movie illustrates a 150 ns explicit solvent all-atom MD simulation carried out under a 500 mV bias directed from the bottom to the top of the simulation system. The nanopore is shown as a cutaway green molecular surface; the protein conformation is depicted as a trace of the protein backbone (magenta). The SDS molecules are shown using the molecular bonds representation: Carbon, sulfur and oxygen atoms are shown in cyan, yellow and red, respectively, hydrogen atoms are not shown. Water and 0.4 M NaCl are now shown as well. During the simulation, the center of mass of the SDS-protein complex was restrained to remain at the symmetry axis of the nanopore. A smoothing filter was applied to visually reduce thermal motion of the molecules. Because of the periodic boundary conditions employed in our MD simulations, the same SDS-protein complex is seen to permeation through the nanopore multiple times. Flickering of the molecules is produced by crossings between different periodic images of the simulation unit cell.
Movie 6. MD simulation of SDS micelle translocation. The movie illustrates a 85 ns explicit solvent all-atom MD simulation carried out under a 250 mV bias directed from the bottom to the top of the simulation system. The nanopore is shown as a cutaway green molecular surface. The SDS molecules are shown using the molecular bonds representation: Carbon, sulfur and oxygen atoms are shown in cyan, yellow and red, respectively, hydrogen atoms are not shown. Water and 0.4 M NaCl are now shown as well. During the simulation, the center of mass of the SDS micelle was restrained to remain at the symmetry axis of the nanopore. A smoothing filter was applied to visually reduce thermal motion of the molecules. Because of the periodic boundary conditions employed in our MD simulations, the micelle is seen to permeation through the nanopore multiple times. Flickering of the molecules is produced by crossings between different periodic images of the simulation unit cell.