Leakless end-to-end transport of small molecules through micron-length DNA nanochannels
Multi-resolution equilibration of DNA pore embedded in a lipid bilayer membrane. Starting from the caDNAno design, the DNA nanopore was simulated at 1 bead per four base pair resolution for the first 20 μs, followed by an 8 μs simulation at 1 bead per nucleotide resolution. In the first part of the movie, which corresponds to the 1 bead per 4 base pair simulation, the DNA nanostructure is represented using light grey lines. In the second part of the movie, which corresponds to the higher-resolution DNA model, the DNA nanostructure is drawn a using the VMD’s Quicksurf representation, with resolution of 1 Å and the radius scale of 3.8 Å. The unfolded scaffold of the DNA origami is not shown. A planar potential applied at the bottom of the nanopore to represent the incorporation of the nanopore into the lipid bilayer membrane; the potential is shown using the RWB color map.
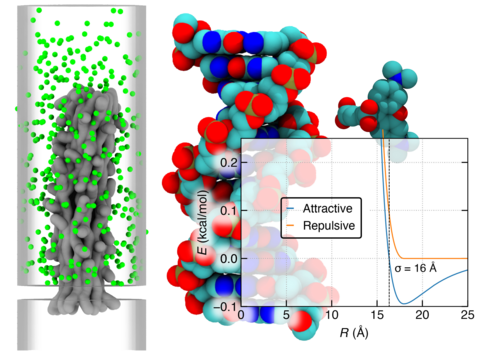
Brownian dynamics simulation of dye diffusion through the DNA pore. The movie illustrates a representative 150 μs Brownian dynamics simulation of 396 dye molecules (green) diffusing through and around a nanopore embedded in a membrane. The interaction of DNA with the dye is described using a truncated LJpotential with σ = 16 Å. The DNA nanopore is represented using a static grid-based interaction potential and a local diffusivity map. The microscopic configuration of the DNA nanopore structure obtained at the end of the multi-resolution equilibration (Supplementary Movie 4) was used to generate this grid-based representation of the membrane-nanopore system. The DNA nanostructure is drawn using a 1 kcal mol –1 isosurface of the dye—DNA potential map (grey).