DNA sequence and methylation prescribe the inside-out conformational dynamics and bending energetics of DNA minicircles.
Eukaryotic genome and methylome encode DNA fragments' propensity to form nucleosome particles. Although the mechanical properties of DNA possibly orchestrate such encoding, the definite link between 'omics' and DNA energetics has remained elusive. Here, we bridge the divide by examining the sequence-dependent energetics of highly bent DNA. Molecular dynamics simulations of 42 intact DNA minicircles reveal that each DNA minicircle undergoes inside-out conformational transitions with the most likely configuration uniquely prescribed by the nucleotide sequence and methylation of DNA. The minicircles' local geometry consists of straight segments connected by sharp bends compressing the DNA's inward-facing major groove. Such an uneven distribution of the bending stress favors minimum free energy configurations that avoid stiff base pair sequences at inward-facing major grooves. Analysis of the minicircles' inside-out free energy landscapes yields a discrete worm-like chain model of bent DNA energetics that accurately account for its nucleotide sequence and methylation. Experimentally measuring the dependence of the DNA looping time on the DNA sequence validates the model. When applied to a nucleosome-like DNA configuration, the model quantitatively reproduces yeast and human genomes' nucleosome occupancy. Further analyses of the genome-wide chromatin structure data suggest that DNA bending energetics is a fundamental determinant of genome architecture.
Movie 1. The 150 ns trajectory of the 85 bp 601LH minicircle. Yellow spheres indicate the phosphate groups that are in contact with the histone core complex in the crystal structure.
Movie 2. The 150 ns trajectory of the 85 bp 601RH minicircle. Yellow spheres indicate the phosphate groups that are in contact with the histone core complex in the crystal structure
Movie 3. The 11 microsecond trajectory of the 90 bp NGO minicircle with a linking number of 8. Red sphere indicates the phosphate that was used as a reference to measure the poloidal angle.
Movie 4. The 40 ns trajectory of the 90 bp NGO minicircle with a linking number of 9.
Movie 5. The 40 ns trajectory of the 90 bp NGO minicircle with a linking number of 7.
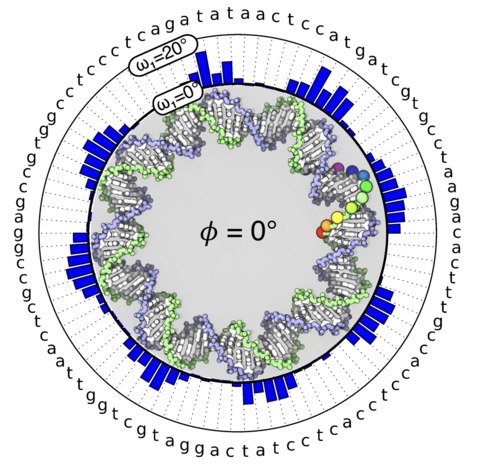
Movie 6. An illustration of the minicircle that changes the poloidal angle from 0 to 360 degree. The poloidal angle is defined as the angle between two red lines: one that connects the center of the entire minicircle to the center of the DNA helix and the other that connects the center of the DNA helix to the reference phosphate
Movie 7. The 2 microsecond trajectory of the 90-bp TA-repeat minicircle with a linking number of 8. Red sphere indicates the phosphate that was used as a reference to measure the poloidal angle.
Movie 8. The 200-ns trajectory of the (cgccCGgcgcg)8cg minicircle with a linking number of 8. Cytosine bases that are targets for methylation are shown in pink.
Movie 9. The 200-ns trajectory of the (cgccmCGgcgcg)8cg minicircle with a linking number of 8. Methyl groups of methylcytosine bases are shown in red spheres
Movie 10. The 800-ns MD trajectory of the 85 bp 601LH minicircle using parmbsc1. One of two replica simulations.
Movie 11. The 800-ns MD trajectory of the 85 bp 601LH minicircle using parmbsc1. The second replica simulation of the system shown in Movie 10.