Picomolar Fingerprinting of Nucleic Acid Nanoparticles Using Solid-State Nanopores

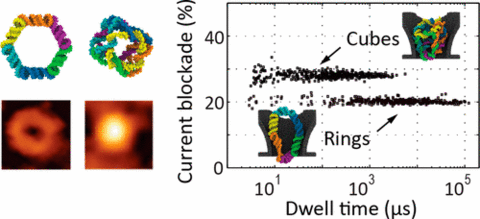
Nucleic acid nanoparticles (NANPs) are an emerging class of programmable structures with tunable shape and function. Their promise as tools for fundamental biophysics studies, molecular sensing, and therapeutic applications necessitates methods for their detection and characterization at the single-particle level. In this work, we study electrophoretic transport of individual ring-shaped and cube-shaped NANPs through solid-state nanopores. In the optimal nanopore size range, the particles must deform to pass through, which considerably increases their residence time within the pore. Such anomalously long residence times permit detection of picomolar amounts of NANPs when nanopore measurements are carried out at a high transmembrane bias. In the case of a NANP mixture, the type of individual particle passing through nanopores can be efficiently determined from analysis of a single electrical pulse. Molecular dynamics simulations provide insight into the mechanical barrier to transport of the NANPs and corroborate the difference in the signal amplitudes observed for the two types of particles. Our study serves as a basis for label-free analysis of soft programmable-shape nanoparticles.
Animation illustrating a 99 ns MD trajectory of a DNA cube translocation through a solid-state nanopore. The simulation began having the edge fo the DNA cube pointing toward the nanopore constriction. The simulation was performed under a 200 mV bias.
Animation illustrating a 70 ns MD trajectory of a DNA cube translocation through a solid-state nanopore. The simulatiion began having a corner of the DNA cube pointing toward the nanopore constriction. The simulation was performed under a 500 mV bias.
Animation illustrating a 115 ns MD trajectory of an RNA ring translocation through a solid-state nanopore. The simulation began with the ring centered in the nanopore and the axis of the nanopore in the plane of the ring. The simulation was performed under a 200 mV bias.
Animation illustrating a 98 ns MD trajectory of a DNA cube translocation through a solid-state nanopore. The simulation began with a face of the DNA cube pointing toward the nanopore constriction. The simulation was performed under a 200 mV bias.
Animation illustrating a 97 ns MD trajectory of a DNA cube translocation through a solid-state nanopore. The simulatiion began having a corner of the DNA cube pointing toward the nanopore constriction. The simulation was performed under a 200 mV bias.