Ionic Conductivity, Structural Deformation, and Programmable Anisotropy of DNA Origami in Electric Field
Molecular dynamic simulations of ionic current through a DNA origami plate. The scaffold and staple strands of the plate are shown in blue and yellow, respectively; Mg2+, Cl- and K+ ions are shown as pink, cyan and ochre spheres, respectively. Water molecules forming magnesium hexahydrate complexes with Mg2+ are explicitly shown in red (oxygen) and white (hydrogen). The movie illustrates a 48 ns MD trajectory of the system at a 100 mV applied potential. The bulk concentrations of KCl and MgCl2 are 1 M and 50 mM, respectively. For clarity, only 10% of the ions are explicitly shown.
Structural dynamics and cross section area fluctuation of the CG (left) / AT (right) DNA origami square lattice plate. Cytosine (C), guanine (G), adenine (A) and thymine (T) nucleotides of the plate are shown in red, yellow, blue and green, respectively; water and ions are not shown. Several periodic images of the cell are shown. The rectangular box indicates the boundary of the unit cell; the instantaneous area is reported in units of nm2. The movie illustrates a 573 (left) / 947 (right) ns equilibration (zero applied bias) of the system at 1 M KCl / 250 mM MgCl2 bulk ion concentration.
Structural dynamics and cross section area fluctuation of the DNA origami square lattice plate with m13mp18 sequence at different Mg2+ concentration. Adenine (A), thymine (T), cytosine (C) and guanine (G) nucleotides of the plate are shown in blue, green, red and yellow, respectively; water and ions are not shown. Several periodic images of the cell are shown. The rectangular box indicates the boundary of the unit cell; the instantaneous area is reported in units of nm2. The MgCl2 concentration and simulation time of each panel are shown below:
| Left | Middle | Right | |
| MgCl2 (mM) | 250 | 131 | 0 |
| Simulation time (ns) | 573 | 654 | 578 |
Reversible deformation of a two-layer DNA origami square lattice plate by electric field. The two layers of the plate are shown in yellow and blue. The arrow indicates application of external electric field corresponding to a 500 mV bias. The instantaneous distance between the scaffold strand in the top and bottom layers of the plate is reported in units of Å. The movie illustrates a 230 ns trajectory of the system at 1 M / 250 mM bulk concentration of KCl / MgCl2.
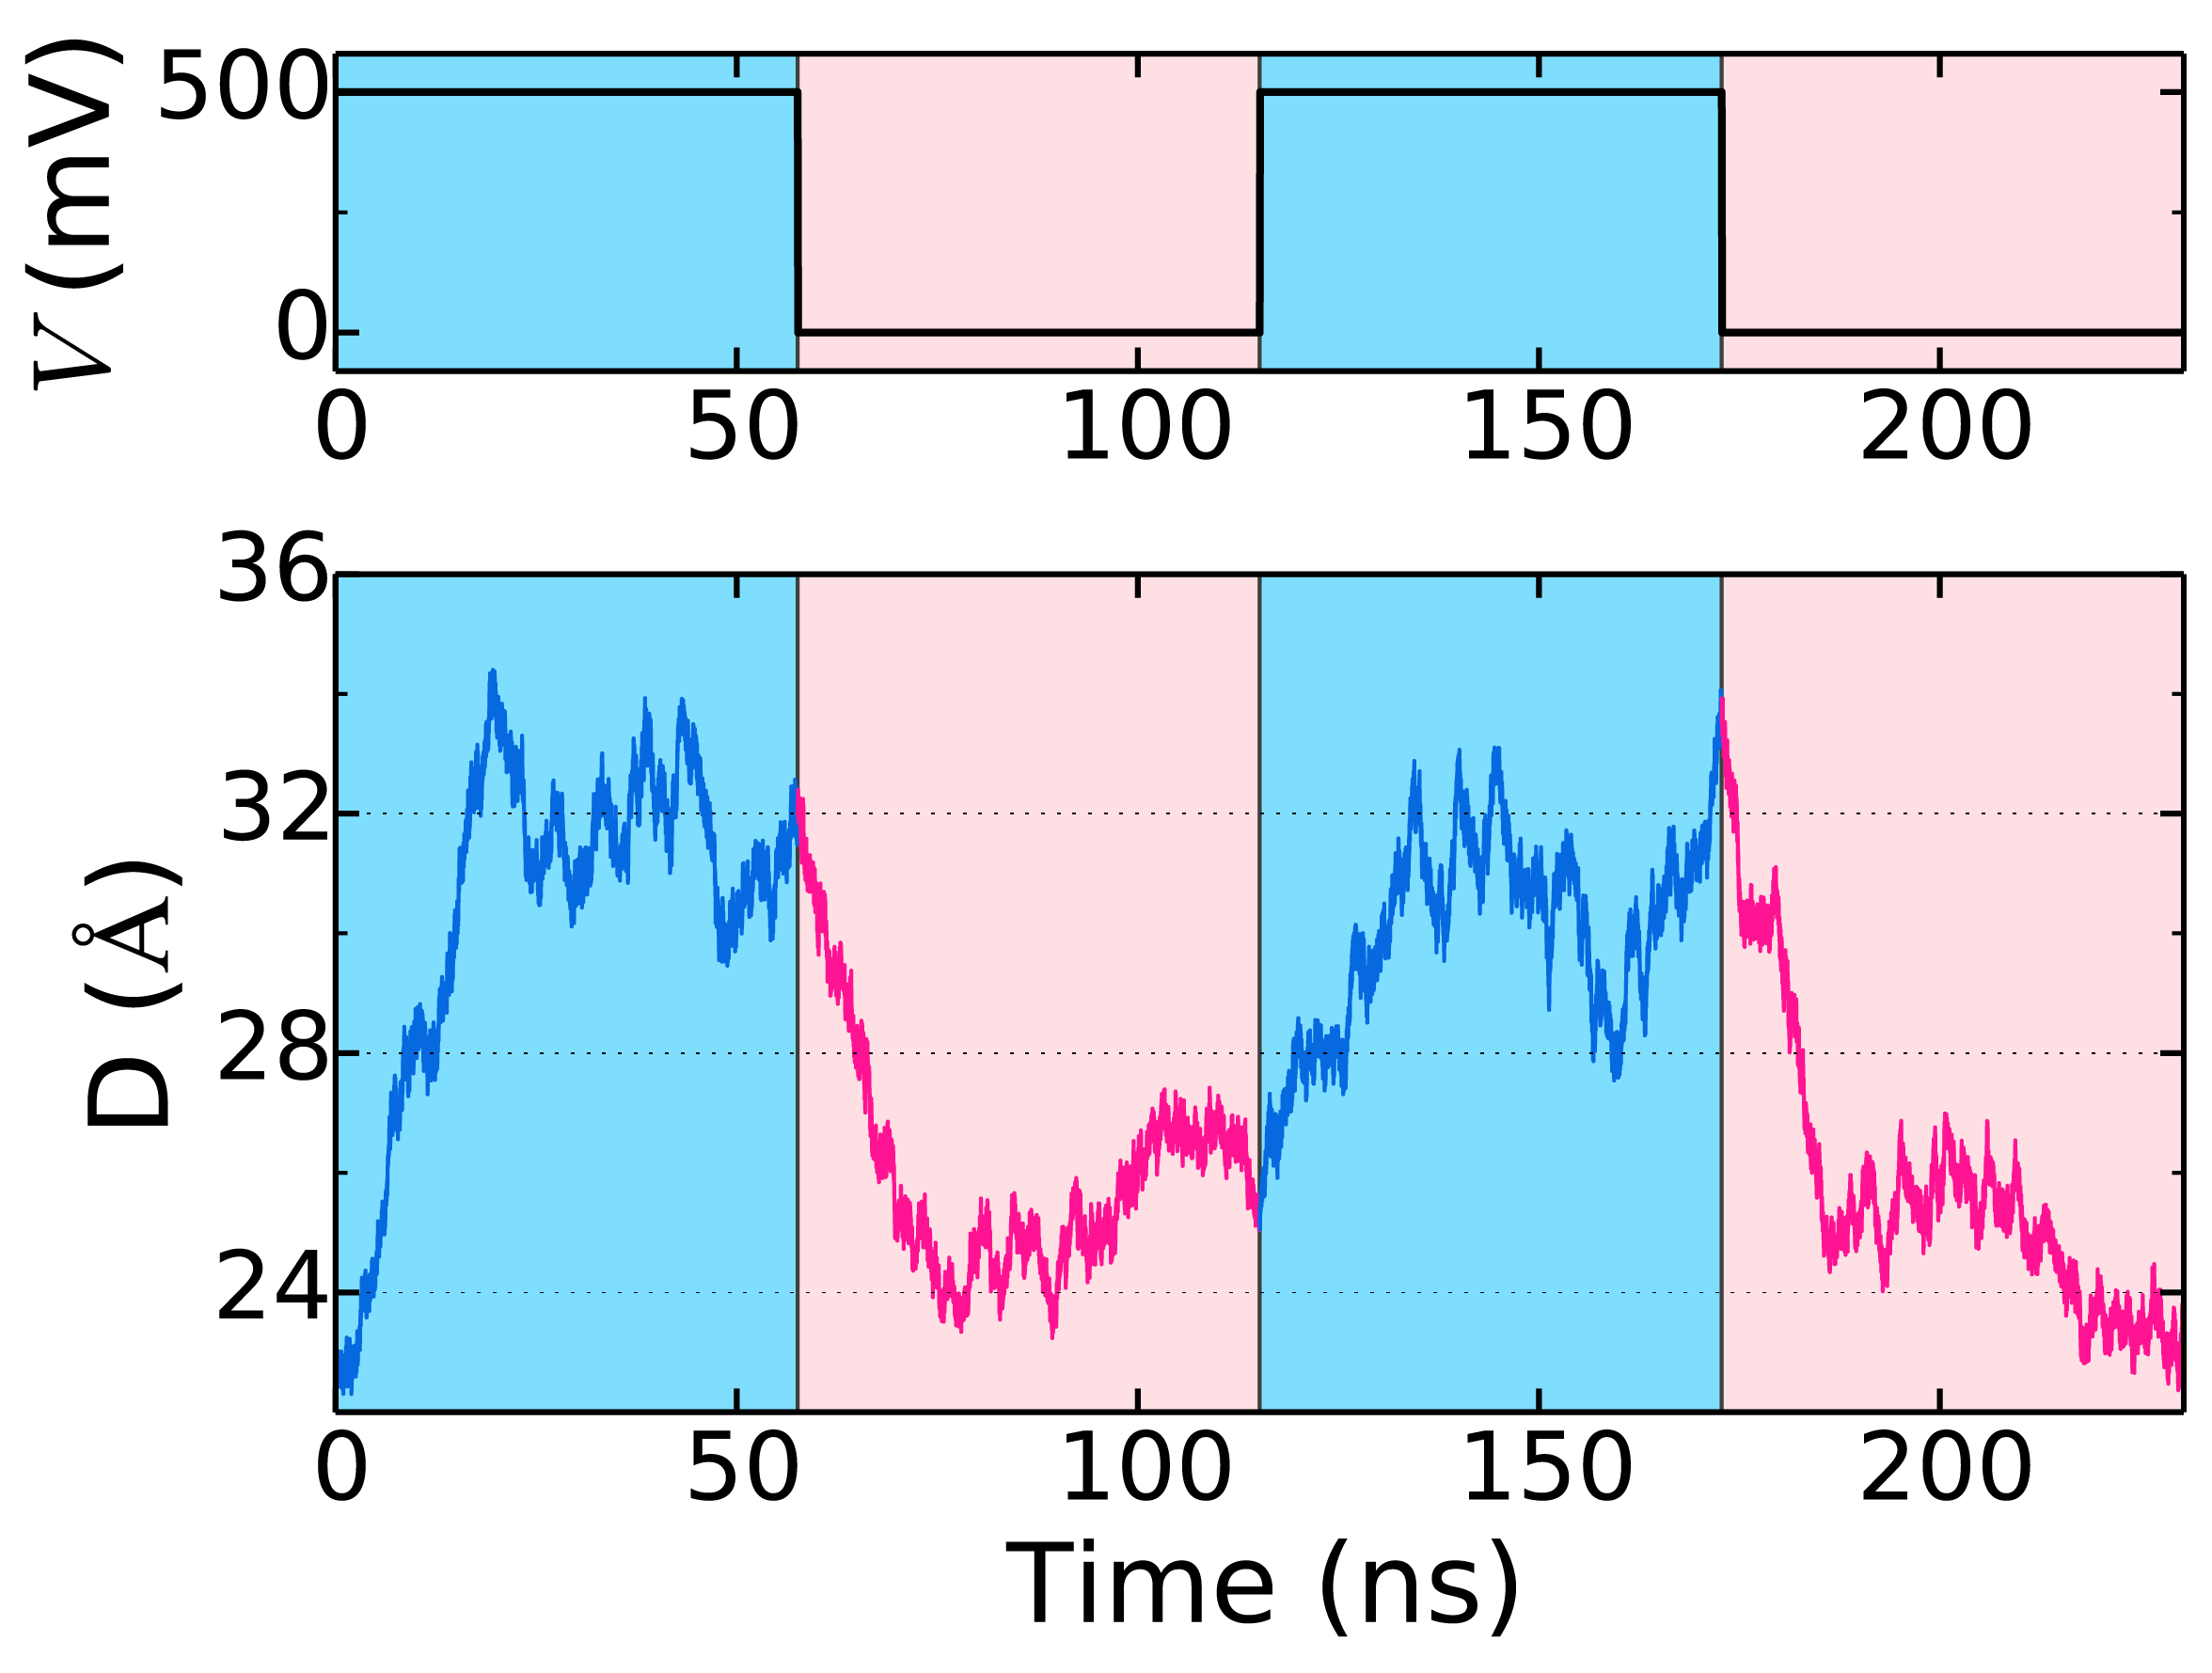
The plot shows the time trace of the distance between the scaffold strands in the top and bottom layer and the corresponding bias.
Electric field induced deformation of a DNA origami plate on top of a SiO2 nanogap. The DNA origami is shown using cyan, green and red lines, SiO2 as red (O) and yellow (Si) spheres; water and ions are not shown. The movie illustrates a 101 ns MD trajectory of the system at a 100 mV (cyan), 250 (green) mV and 500 mV (red) applied potential and 1 M / 50 mM bulk concentration of KCl / MgCl2.
Electric field induced deformation of a DNA origami plate on top of a SiO2 nanogap. The scaffold and staple strands of the origami are shown as blue and yellow lines, respectively. SiO2 is shown as red (O) and yellow (Si) spheres; water and ions are not shown. The movie illustrates a 34 ns MD trajectory of the system at a 1000 mV applied potential and 1 M / 50 mM bulk concentration of KCl / MgCl2.